Giornalisti
Dove si concentrano le fiduciarie?
Confrontare cantoni e città di registrazione, individuare i poli regionali e collocare le affermazioni locali nel contesto nazionale.
Dati sulle aziende svizzere
Questa edizione di aprile 2026 raggruppa 17.771 aziende svizzere classificate come fiduciarie o studi contabili. Mostra dove sono registrate, quando sono state fondate e come è strutturato il mercato.
Domande concrete
Giornalisti
Confrontare cantoni e città di registrazione, individuare i poli regionali e collocare le affermazioni locali nel contesto nazionale.
Ricercatori
Usare periodi di fondazione e forme giuridiche per studiare le differenze tra territori e generazioni di aziende.
Cantoni e promozione economica
Confrontare consistenza e profilo di fondazione del cantone con il quadro nazionale e individuare i maggiori centri di registrazione.
Fiduciarie e PMI
Confrontare un cantone o una città senza pubblicare contatti, direttori o decisioni di classificazione delle singole aziende.
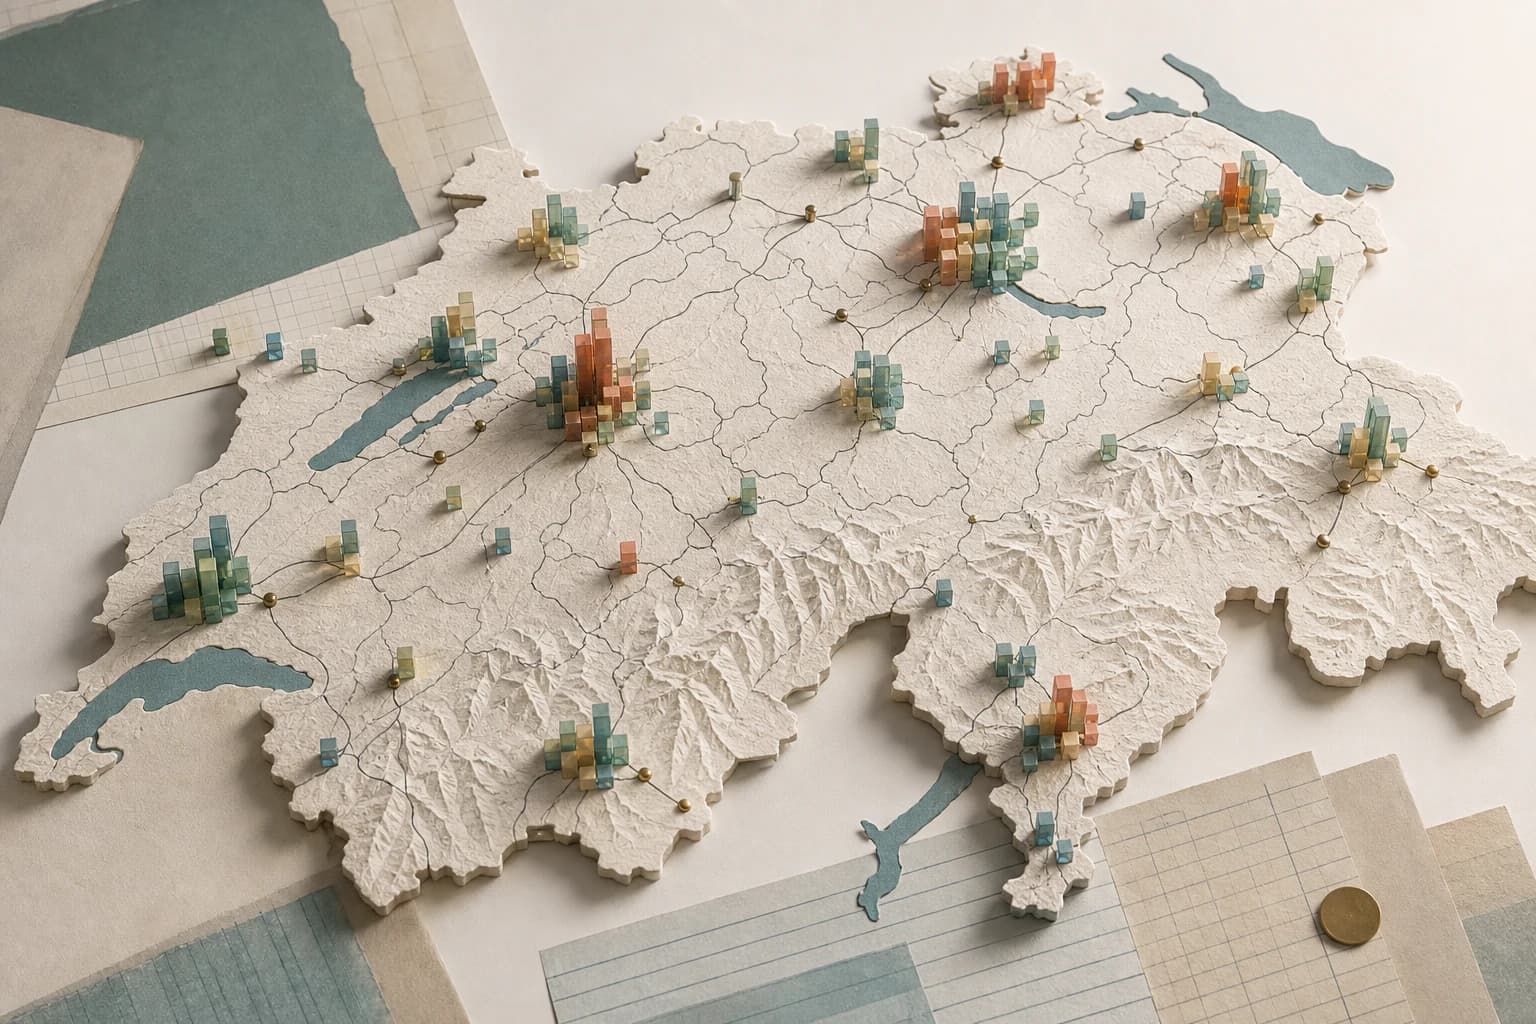
Distribuzione per cantone
ZH / Zurigo
aziende classificate
3’340
| Posizione | Cantone | Aziende | Quota |
|---|---|---|---|
| 1 | Zurigo (ZH) | 3340 | 18.8% |
| 2 | Ginevra (GE) | 1514 | 8.5% |
| 3 | Berna (BE) | 1464 | 8.2% |
| 4 | Vaud (VD) | 1429 | 8.0% |
| 5 | Zugo (ZG) | 1365 | 7.7% |
| 6 | Argovia (AG) | 1068 | 6.0% |
| 7 | San Gallo (SG) | 1062 | 6.0% |
| 8 | Lucerna (LU) | 830 | 4.7% |
| 9 | Vallese (VS) | 610 | 3.4% |
| 10 | Basilea Campagna (BL) | 576 | 3.2% |
| 11 | Ticino (TI) | 567 | 3.2% |
| 12 | Svitto (SZ) | 560 | 3.2% |
| 13 | Turgovia (TG) | 529 | 3.0% |
| 14 | Friburgo (FR) | 495 | 2.8% |
| 15 | Grigioni (GR) | 451 | 2.5% |
| 16 | Basilea Città (BS) | 419 | 2.4% |
| 17 | Soletta (SO) | 392 | 2.2% |
| 18 | Neuchâtel (NE) | 270 | 1.5% |
| 19 | Nidvaldo (NW) | 164 | 0.9% |
| 20 | Sciaffusa (SH) | 148 | 0.8% |
| 21 | Appenzello Esterno (AR) | 135 | 0.8% |
| 22 | Obvaldo (OW) | 111 | 0.6% |
| 23 | Giura (JU) | 100 | 0.6% |
| 24 | Glarona (GL) | 82 | 0.5% |
| 25 | Appenzello Interno (AI) | 49 | 0.3% |
| 26 | Uri (UR) | 40 | 0.2% |
Cosa mostrano i dati
I totali per cantone mostrano la distribuzione nazionale. Le città e le date di fondazione indicano dove il mercato è più denso e quando sono nate le aziende oggi attive.
27.1%
delle aziende classificate è registrato nelle dodici principali città
4329
aziende sono state fondate dal 2020 in poi
71.8%
delle aziende del Canton Zugo è registrato a Zugo, Baar o Cham
Zurigo da solo conta 3.340 aziende classificate. Seguono Ginevra, Berna, Vaud e Zugo.
Zurigo e Ginevra sono i due maggiori poli urbani. Zugo, Basilea e Baar formano il gruppo successivo.
Quasi un quarto delle aziende con una data di fondazione è stato costituito dal 2020 in poi.
841
1199
2416
4059
4894
4329
Le Sagl e le SA rappresentano la maggior parte delle aziende classificate.
Ogni riga raggruppa le aziende oggi registrate nella città in base al periodo di fondazione.
1139 aziende
926 aziende
578 aziende
392 aziende
274 aziende
268 aziende
265 aziende
228 aziende
224 aziende
219 aziende
| Posizione | Città | Cantone | Aziende | Aziende con data di fondazione | Fondate nel 2020-2026 | Quota dal 2020 | Prima del 1980 | 1980-1989 | 1990-1999 | 2000-2009 | 2010-2019 | 2020-2026 |
|---|---|---|---|---|---|---|---|---|---|---|---|---|
| 1 | Zürich | ZH | 1140 | 1139 | 237 | 20.8% | 95 | 97 | 151 | 233 | 326 | 237 |
| 2 | Genève | GE | 926 | 926 | 246 | 26.6% | 53 | 79 | 84 | 164 | 300 | 246 |
| 3 | Zug | ZG | 578 | 578 | 126 | 21.8% | 41 | 41 | 81 | 143 | 146 | 126 |
| 4 | Basel | BS | 392 | 392 | 83 | 21.2% | 28 | 32 | 60 | 80 | 109 | 83 |
| 5 | Baar | ZG | 274 | 274 | 88 | 32.1% | 2 | 20 | 34 | 65 | 65 | 88 |
| 6 | Lausanne | VD | 268 | 268 | 62 | 23.1% | 24 | 22 | 25 | 41 | 94 | 62 |
| 7 | Luzern | LU | 265 | 265 | 49 | 18.5% | 33 | 29 | 30 | 50 | 74 | 49 |
| 8 | Bern | BE | 228 | 228 | 42 | 18.4% | 14 | 25 | 47 | 57 | 43 | 42 |
| 9 | Lugano | TI | 224 | 224 | 30 | 13.4% | 22 | 29 | 31 | 56 | 56 | 30 |
| 10 | St. Gallen | SG | 219 | 219 | 41 | 18.7% | 14 | 23 | 36 | 55 | 50 | 41 |
| 11 | Winterthur | ZH | 168 | 168 | 27 | 16.1% | 8 | 13 | 27 | 41 | 52 | 27 |
| 12 | Chur | GR | 137 | 137 | 23 | 16.8% | 19 | 7 | 28 | 28 | 32 | 23 |
| 13 | Cham | ZG | 128 | 128 | 38 | 29.7% | 4 | 8 | 21 | 26 | 31 | 38 |
| 14 | Carouge GE | GE | 105 | 105 | 29 | 27.6% | 6 | 6 | 8 | 31 | 25 | 29 |
| 15 | Fribourg | FR | 95 | 95 | 28 | 29.5% | 11 | 14 | 13 | 11 | 18 | 28 |
| 16 | Biel/Bienne | BE | 87 | 87 | 24 | 27.6% | 10 | 6 | 16 | 15 | 16 | 24 |
| 17 | Sion | VS | 83 | 83 | 23 | 27.7% | 5 | 2 | 10 | 18 | 25 | 23 |
| 18 | Dübendorf | ZH | 83 | 83 | 22 | 26.5% | 5 | 9 | 9 | 18 | 20 | 22 |
| 19 | Neuchâtel | NE | 82 | 82 | 27 | 32.9% | 3 | 10 | 10 | 13 | 19 | 27 |
| 20 | Rotkreuz | ZG | 79 | 79 | 19 | 24.1% | 2 | 6 | 11 | 16 | 25 | 19 |
Zurigo e Ginevra raccolgono insieme 2.066 aziende, pari all’11,6% del totale nazionale classificato.
Zugo, Baar e Cham raccolgono 980 aziende, pari al 71,8% del totale cantonale. È la concentrazione su più città più netta nei dati.
Tra le dieci principali città, Baar ha la quota più alta di aziende fondate tra il 2020 e il 2026, pari al 32,1%. Lugano ha la più bassa, pari al 13,4%.
Metodo
La stessa procedura è stata applicata a ogni azienda nell’istantanea di origine.
Vedi la fonte ufficiale Zefix01
L’istantanea di origine si basa sulle informazioni del registro di commercio disponibili tramite Zefix e sulle fonti ufficiali collegate.
02
Le ragioni sociali e gli scopi societari registrati sono stati esaminati usando termini come Treuhand, Buchhaltung, fiduciaire, comptabilité, fiduciaria e contabilità.
03
Gemini 3.1 Flash Lite ha applicato un secondo filtro per determinare quali aziende, tra quelle preselezionate, offrono effettivamente servizi fiduciari o contabili. Per ogni azienda il modello ha esaminato tutte le informazioni disponibili, tra cui ragione sociale, descrizione e scopo societario registrato. Lo scopo societario è stato il principale criterio decisionale.
04
Le classificazioni ottenute sono state aggregate in modo uniforme e analizzate per cantone e città di registrazione, periodo di fondazione e forma giuridica. Tutti i grafici si basano sull’istantanea di aprile 2026.