The largest cantons
Zurich alone accounts for 3,340 classified firms. Geneva, Bern, Vaud and Zug follow.
- 01ZH3'340
- 02GE1'514
- 03BE1'464
- 04VD1'429
- 05ZG1'365
- 06AG1'068
- 07SG1'062
- 08LU830
- 09VS610
- 10BL576
Swiss company data
This April 2026 edition groups 17,771 Swiss companies classified as fiduciary or accounting firms. It shows where they are registered, when they were founded and how the market is structured.
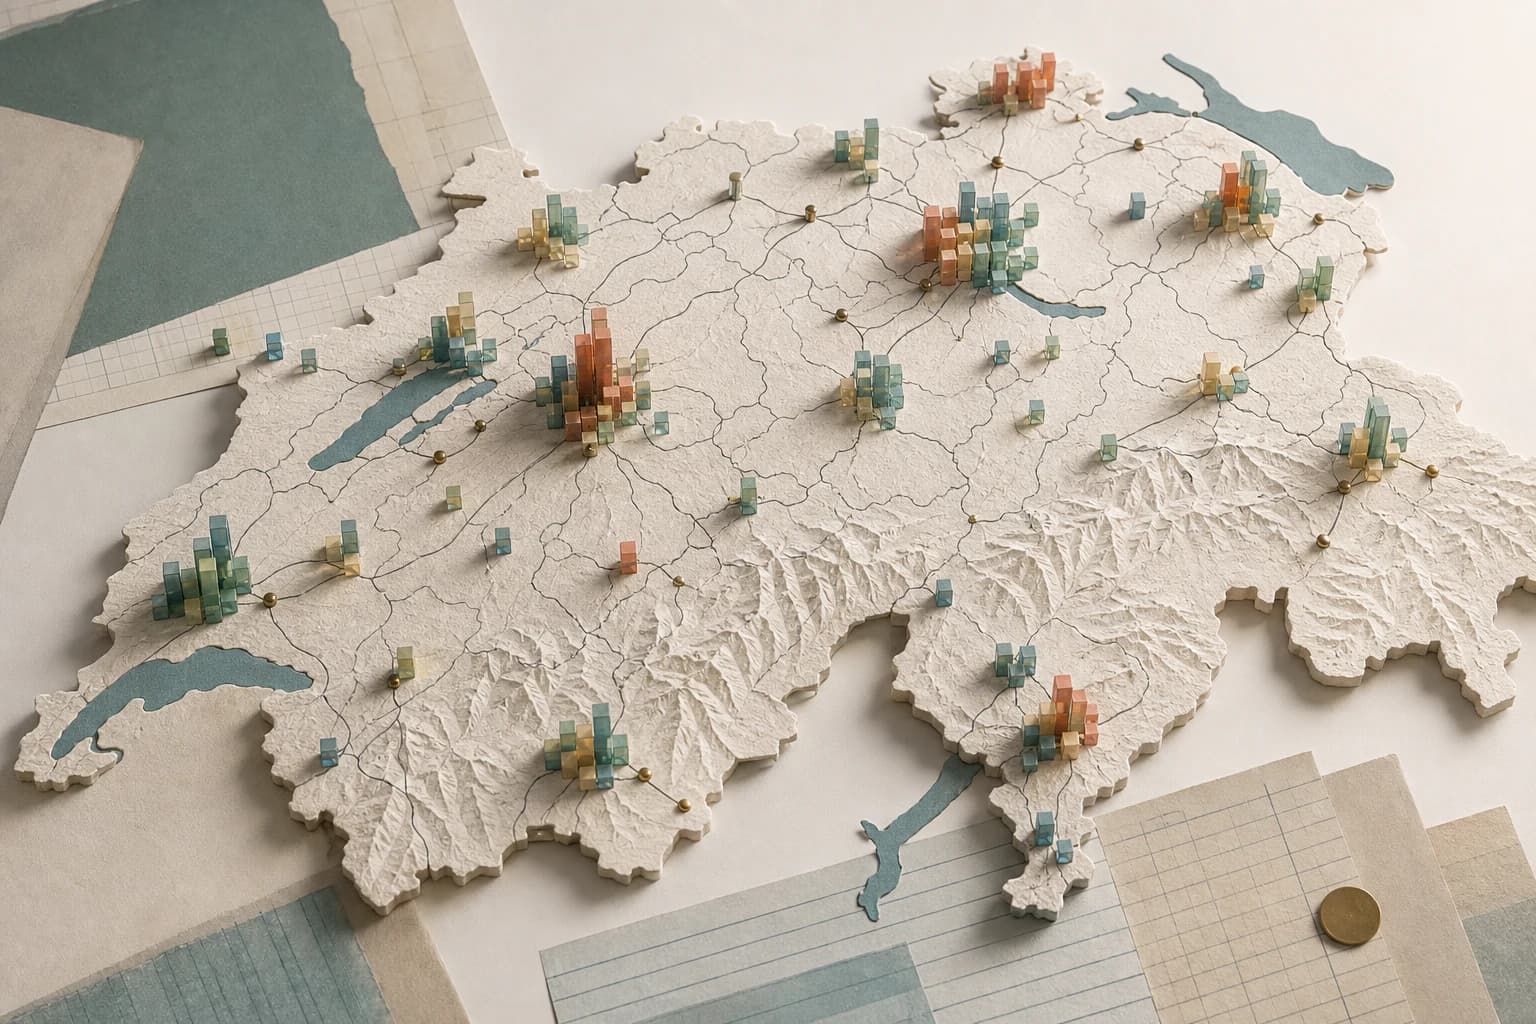
Canton distribution
| Rank | Canton | Companies | Share |
|---|---|---|---|
| 1 | Zurich (ZH) | 3'340 | 18.8% |
| 2 | Geneva (GE) | 1'514 | 8.5% |
| 3 | Bern (BE) | 1'464 | 8.2% |
| 4 | Vaud (VD) | 1'429 | 8.0% |
| 5 | Zug (ZG) | 1'365 | 7.7% |
| 6 | Aargau (AG) | 1'068 | 6.0% |
| 7 | St. Gallen (SG) | 1'062 | 6.0% |
| 8 | Lucerne (LU) | 830 | 4.7% |
| 9 | Valais (VS) | 610 | 3.4% |
| 10 | Basel-Landschaft (BL) | 576 | 3.2% |
| 11 | Ticino (TI) | 567 | 3.2% |
| 12 | Schwyz (SZ) | 560 | 3.2% |
| 13 | Thurgau (TG) | 529 | 3.0% |
| 14 | Fribourg (FR) | 495 | 2.8% |
| 15 | Graubünden (GR) | 451 | 2.5% |
| 16 | Basel-Stadt (BS) | 419 | 2.4% |
| 17 | Solothurn (SO) | 392 | 2.2% |
| 18 | Neuchâtel (NE) | 270 | 1.5% |
| 19 | Nidwalden (NW) | 164 | 0.9% |
| 20 | Schaffhausen (SH) | 148 | 0.8% |
| 21 | Appenzell Ausserrhoden (AR) | 135 | 0.8% |
| 22 | Obwalden (OW) | 111 | 0.6% |
| 23 | Jura (JU) | 100 | 0.6% |
| 24 | Glarus (GL) | 82 | 0.5% |
| 25 | Appenzell Innerrhoden (AI) | 49 | 0.3% |
| 26 | Uri (UR) | 40 | 0.2% |
What the data says
Canton totals show the national distribution. City and founding data show where the market is densest and how today's active firms were formed over time.
27.1%
of classified companies are registered in the twelve largest cities
4'329
companies were founded from 2020 onward
71.8%
of Zug canton firms are registered in Zug, Baar or Cham
Zurich alone accounts for 3,340 classified firms. Geneva, Bern, Vaud and Zug follow.
Zürich and Genève are the two largest city clusters. Zug, Basel and Baar form the next tier.
Almost a quarter of the firms with a founding date were created from 2020 onward.
841
1'199
2'416
4'059
4'894
4'329
GmbH and AG structures account for most of the classified firms.
Each row groups the firms currently registered in that city by founding period.
| City | Before 1980 | 1980-1989 | 1990-1999 | 2000-2009 | 2010-2019 | 2020-2026 | Companies |
|---|---|---|---|---|---|---|---|
| Zürich ZH | 95 | 97 | 151 | 233 | 326 | 237 | 1'139 |
| Genève GE | 53 | 79 | 84 | 164 | 300 | 246 | 926 |
| Zug ZG | 41 | 41 | 81 | 143 | 146 | 126 | 578 |
| Basel BS | 28 | 32 | 60 | 80 | 109 | 83 | 392 |
| Baar ZG | 2 | 20 | 34 | 65 | 65 | 88 | 274 |
| Lausanne VD | 24 | 22 | 25 | 41 | 94 | 62 | 268 |
| Luzern LU | 33 | 29 | 30 | 50 | 74 | 49 | 265 |
| Bern BE | 14 | 25 | 47 | 57 | 43 | 42 | 228 |
| Lugano TI | 22 | 29 | 31 | 56 | 56 | 30 | 224 |
| St. Gallen SG | 14 | 23 | 36 | 55 | 50 | 41 | 219 |
| Rank | City | Canton | Companies | Companies with a founding date | Founded 2020-2026 | Recent share | Before 1980 | 1980-1989 | 1990-1999 | 2000-2009 | 2010-2019 | 2020-2026 |
|---|---|---|---|---|---|---|---|---|---|---|---|---|
| 1 | Zürich | ZH | 1'140 | 1'139 | 237 | 20.8% | 95 | 97 | 151 | 233 | 326 | 237 |
| 2 | Genève | GE | 926 | 926 | 246 | 26.6% | 53 | 79 | 84 | 164 | 300 | 246 |
| 3 | Zug | ZG | 578 | 578 | 126 | 21.8% | 41 | 41 | 81 | 143 | 146 | 126 |
| 4 | Basel | BS | 392 | 392 | 83 | 21.2% | 28 | 32 | 60 | 80 | 109 | 83 |
| 5 | Baar | ZG | 274 | 274 | 88 | 32.1% | 2 | 20 | 34 | 65 | 65 | 88 |
| 6 | Lausanne | VD | 268 | 268 | 62 | 23.1% | 24 | 22 | 25 | 41 | 94 | 62 |
| 7 | Luzern | LU | 265 | 265 | 49 | 18.5% | 33 | 29 | 30 | 50 | 74 | 49 |
| 8 | Bern | BE | 228 | 228 | 42 | 18.4% | 14 | 25 | 47 | 57 | 43 | 42 |
| 9 | Lugano | TI | 224 | 224 | 30 | 13.4% | 22 | 29 | 31 | 56 | 56 | 30 |
| 10 | St. Gallen | SG | 219 | 219 | 41 | 18.7% | 14 | 23 | 36 | 55 | 50 | 41 |
| 11 | Winterthur | ZH | 168 | 168 | 27 | 16.1% | 8 | 13 | 27 | 41 | 52 | 27 |
| 12 | Chur | GR | 137 | 137 | 23 | 16.8% | 19 | 7 | 28 | 28 | 32 | 23 |
| 13 | Cham | ZG | 128 | 128 | 38 | 29.7% | 4 | 8 | 21 | 26 | 31 | 38 |
| 14 | Carouge GE | GE | 105 | 105 | 29 | 27.6% | 6 | 6 | 8 | 31 | 25 | 29 |
| 15 | Fribourg | FR | 95 | 95 | 28 | 29.5% | 11 | 14 | 13 | 11 | 18 | 28 |
| 16 | Biel/Bienne | BE | 87 | 87 | 24 | 27.6% | 10 | 6 | 16 | 15 | 16 | 24 |
| 17 | Sion | VS | 83 | 83 | 23 | 27.7% | 5 | 2 | 10 | 18 | 25 | 23 |
| 18 | Dübendorf | ZH | 83 | 83 | 22 | 26.5% | 5 | 9 | 9 | 18 | 20 | 22 |
| 19 | Neuchâtel | NE | 82 | 82 | 27 | 32.9% | 3 | 10 | 10 | 13 | 19 | 27 |
| 20 | Rotkreuz | ZG | 79 | 79 | 19 | 24.1% | 2 | 6 | 11 | 16 | 25 | 19 |
Zürich and Genève contain 2,066 firms together, 11.6% of the national classified total.
Zug, Baar and Cham contain 980 firms, 71.8% of the Zug canton total. This is the clearest multi-city cluster in the data.
Baar has the highest 2020-2026 share among the ten largest cities at 32.1%. Lugano has the lowest at 13.4%.
Method
The same process is applied to every company in the source snapshot.
View the official Zefix source01
The source snapshot draws on Swiss commercial-register information available through Zefix and associated official register sources.
02
Company names and stated purposes were screened for terms such as Treuhand, Buchhaltung, fiduciaire, comptabilité, fiduciaria and contabilità.
03
Gemini 3.1 Flash Lite applied a second filter to determine which preselected companies actually provide fiduciary or accounting services. For each company, it considered all available context, including the company name, description and registered purpose. The registered purpose was the main deciding factor.
04
The resulting classifications were aggregated consistently and analyzed by registered canton and city, founding period and legal form. Every chart uses the April 2026 snapshot.